MSA Software for Gauge R&R and Measurement Studies
Before you trust a measurement, you have to trust the thing that took it. MSA is how you find out whether the variation you are seeing is the process or the gauge.
Already have an account? Login
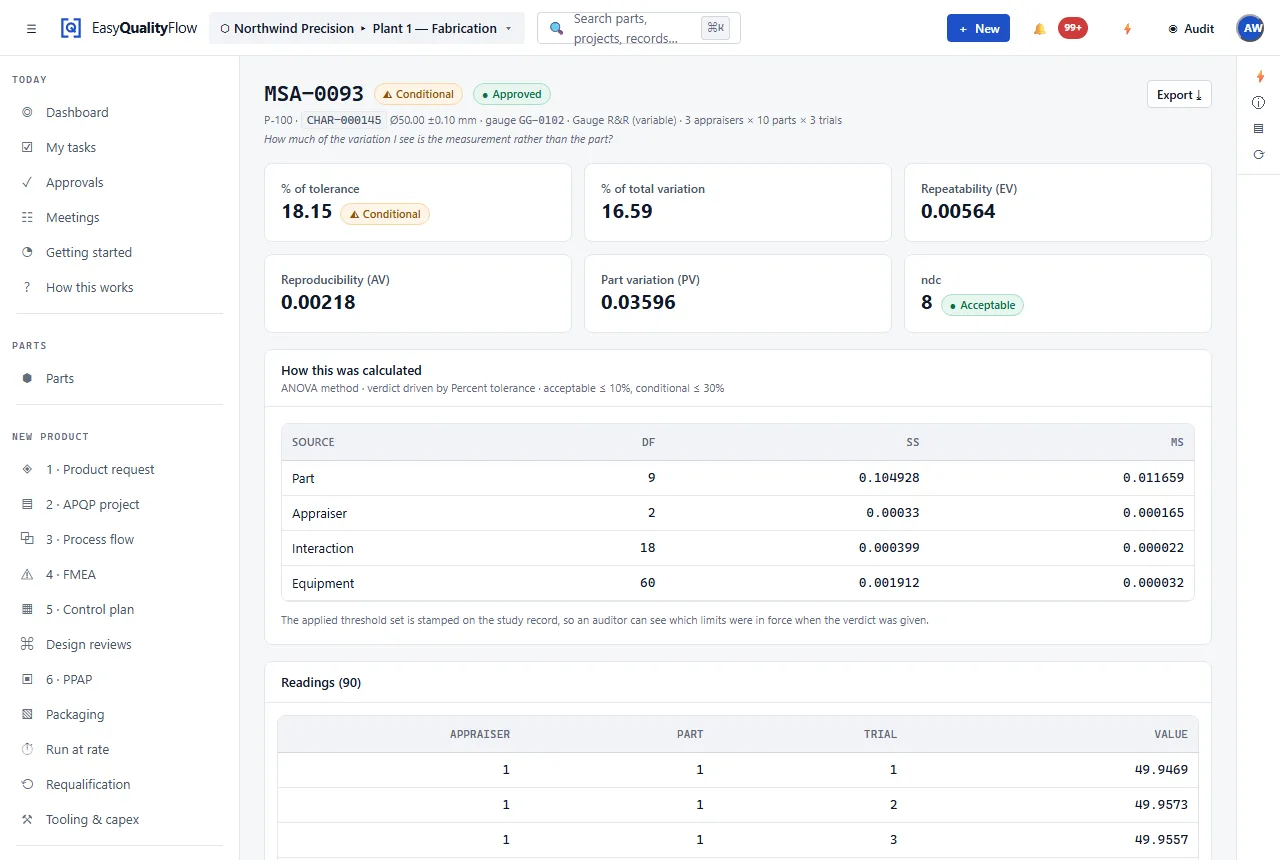
A capability study on an untrusted gauge is arithmetic, not evidence.
Every number in a control chart, a capability index and a submission came off a gauge. If that gauge contributes a third of the observed variation, the process looks worse than it is — and the improvement effort goes to the wrong place. MSA separates the two.
The reason it gets skipped is usually filing rather than statistics: the study is done in a spreadsheet, the verdict lives in a folder, and nothing connects it to the characteristic it qualifies. Held against the gauge and the characteristic, the study is a record a submission can reference and an auditor can follow.
Gauge R&R
Repeatability and reproducibility by the average-and-range and ANOVA methods, with the percentage of study variation and the number of distinct categories.
Beyond R&R
Bias, linearity, stability and attribute agreement — the four studies that get left out when a spreadsheet only does one.
Tied to the gauge
A study belongs to the gauge that was used, so its calibration state is part of the picture.
Tied to the characteristic
The verdict attaches to what was being measured, not to a filename.
Verdict, not just numbers
Acceptable, marginal or unacceptable — stated, with the figures that decided it.
Referenced by PPAP
The submission points at the study rather than embedding a screenshot of one.
MSA sits between the control plan and the inspection.
The control plan says which gauge measures a characteristic. MSA says whether that gauge is capable of it. Inspection then records results you have reason to believe.
- Gauge R&R by average-and-range and ANOVA
- Bias, linearity, stability and attribute agreement studies
- Percentage study variation and distinct categories
- Studies held against the gauge and the characteristic
- A stated verdict with the figures behind it
- Referenced directly by a PPAP submission
Connected capabilities
Every one of these works on the same record. That is the point of the platform.
Questions about MSA software
What is MSA?
What does gauge R&R actually measure?
Which method does the software use?
Do we need MSA for every characteristic?
Does an MSA study affect a PPAP submission?
Know whether it is the process or the gauge.
Bring APQP, FMEA, PPAP, process flow, control plans, inspection and SPC into one connected platform.
Questions? support@easyqualityflow.com