SPC Software for Process Control and Capability
Every part inside tolerance is not the same as a process in control. Control charts show you the difference, and they show it while there is still time to act.
Already have an account? Login
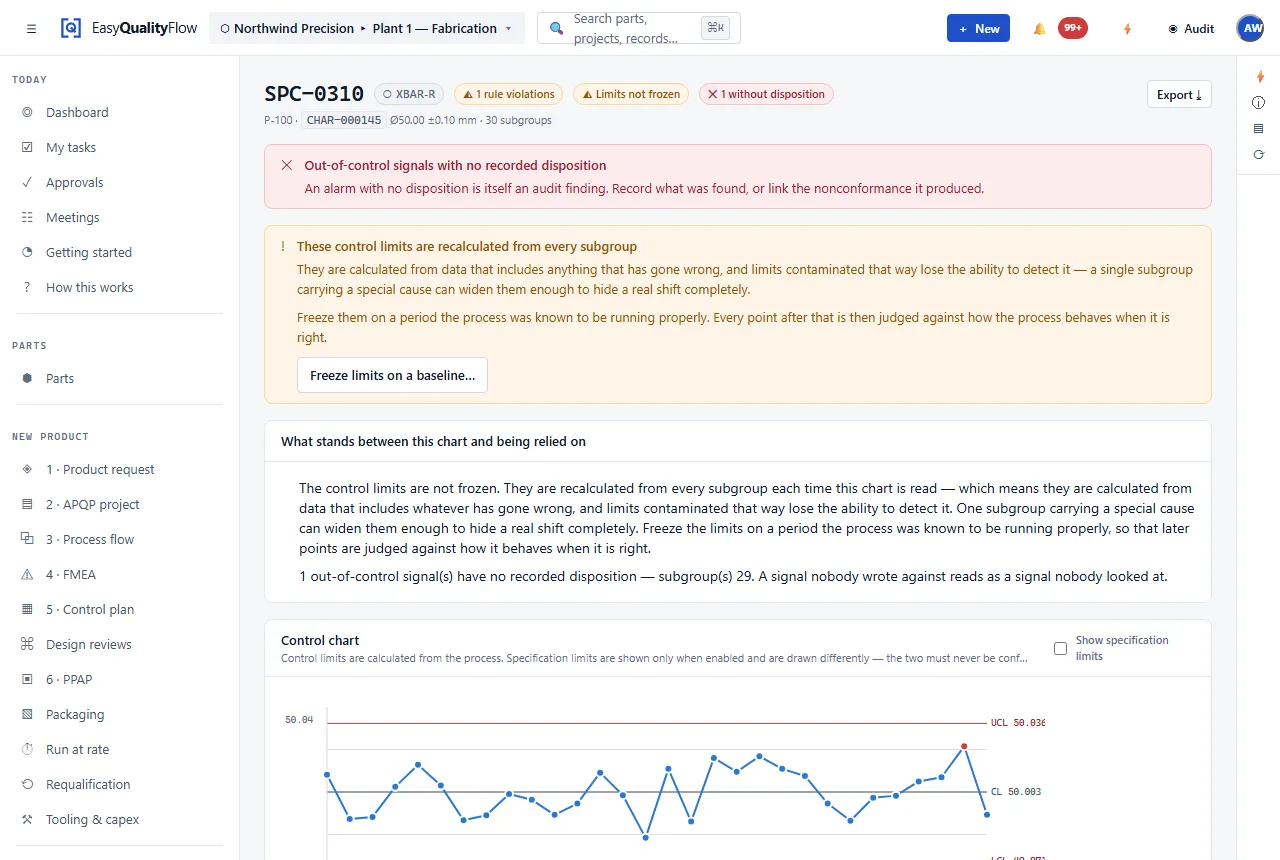
Tolerance tells you about parts. Control tells you about the process.
A process can produce a hundred conforming parts in a row while walking steadily toward a limit. Judged part by part, everything passes. Judged as a process, it has been sending a signal for two hours. Control limits are calculated from the process’s own variation, which is why they catch things a tolerance check cannot.
The other half of the problem is data entry. If chart data is typed in separately from inspection, charting becomes a task somebody does on Fridays. Drawing charts from the inspection results already recorded is what makes monitoring continuous rather than retrospective.
X̄–R charts
Subgroup means and ranges with control limits calculated from the data using the standard constants.
Nelson rules
Out-of-control signals detected by rule, not by eye — including runs and trends a person would miss.
Capability indices
Cp, Cpk, Pp and Ppk, with the distinction between short-term and long-term kept intact.
Fed from inspection
Charts are built from recorded inspection results rather than a separate data-entry step.
Traceable signals
A signal points back at the characteristic, the operation and the control that should have caught it.
Studies as records
A capability study is a record you can reference from a submission, not a screenshot.
SPC is where the loop closes.
A signal on a chart sends you back up the chain — to the control that missed it, the PFMEA row that specified that control, and the operation where it happens. That path is what makes monitoring actionable.
- X̄–R charts with calculated control limits
- Nelson rules for out-of-control detection
- Cp, Cpk, Pp and Ppk
- Charts built from recorded inspection results
- Signals traceable to characteristic, operation and control
- Capability studies referenced by PPAP submissions
Connected capabilities
Every one of these works on the same record. That is the point of the platform.
Questions about SPC software
What is SPC?
What is the difference between Cp and Cpk?
What is the difference between Cp/Cpk and Pp/Ppk?
Does the software include predictive analytics?
Do we have to enter data twice for inspection and SPC?
See variation while you can still do something about it.
Bring APQP, FMEA, PPAP, process flow, control plans, inspection and SPC into one connected platform.
Questions? support@easyqualityflow.com